For CFOs and owners of distributors and manufacturers
In a distributor or manufacturer the gap hides in inventory data nobody has tested. I find it, price it in dollars, and hand it back before a lender, a buyer or your board finds it first.

Sharon Custer. Fortune 500 inventory finance at 3M, registered Cin7 partner, and AI workflows that produce numbers a CFO can sign.
See what is trapped in slow stock, and what comes back if you shift 15, 25 or 35 percent of it.
Put your figures inThe variance is not random. It repeats in the same place, and that place is usually cost timing.
Read the patternWhat a month looks like when the exceptions are ranked instead of hunted. Live, on sample data.
Open the dashboardThe one page you would hand upward: reported number, restated number, what the gap is worth.
See the result firstOne closing workflow run three ways, with the file and two datasets, so you can see what changes.
Take the free exerciseWhat the work produces
Each one settled a decision somebody was carrying: what cash is trapped, what the month is really costing, whether the commitment holds. Open one and see for yourself. Sample data, real shape.
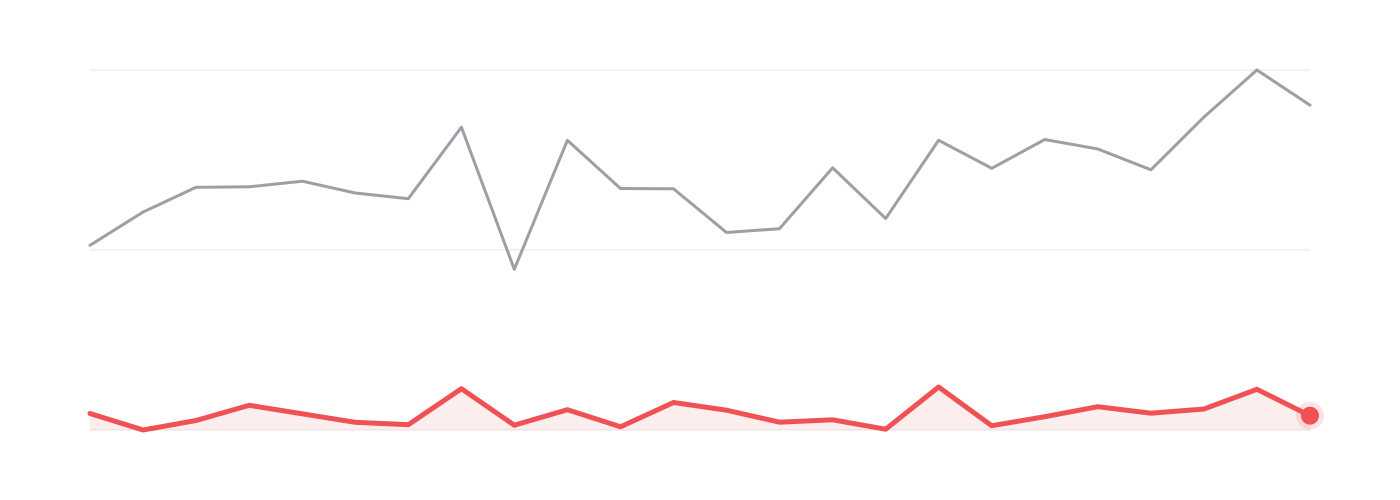 $264,590 sitting still for 180 days
CashWorking capitalDead stock
$264,590 sitting still for 180 days
CashWorking capitalDead stock
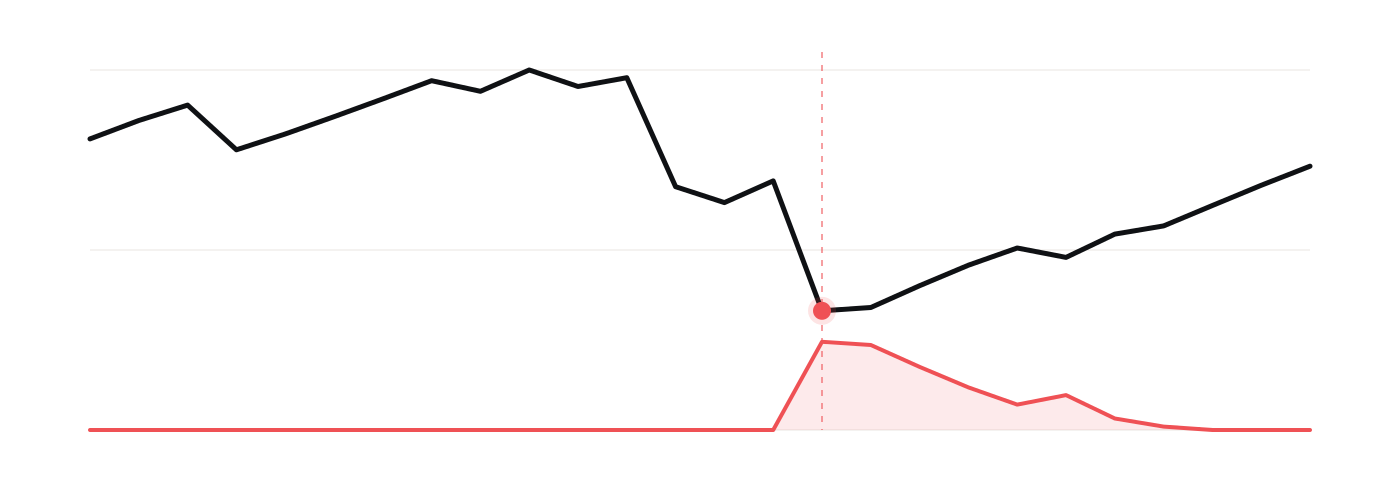 Liquidity falls, financing starts in June
Working capitalLiquidityResource allocation
Liquidity falls, financing starts in June
Working capitalLiquidityResource allocation
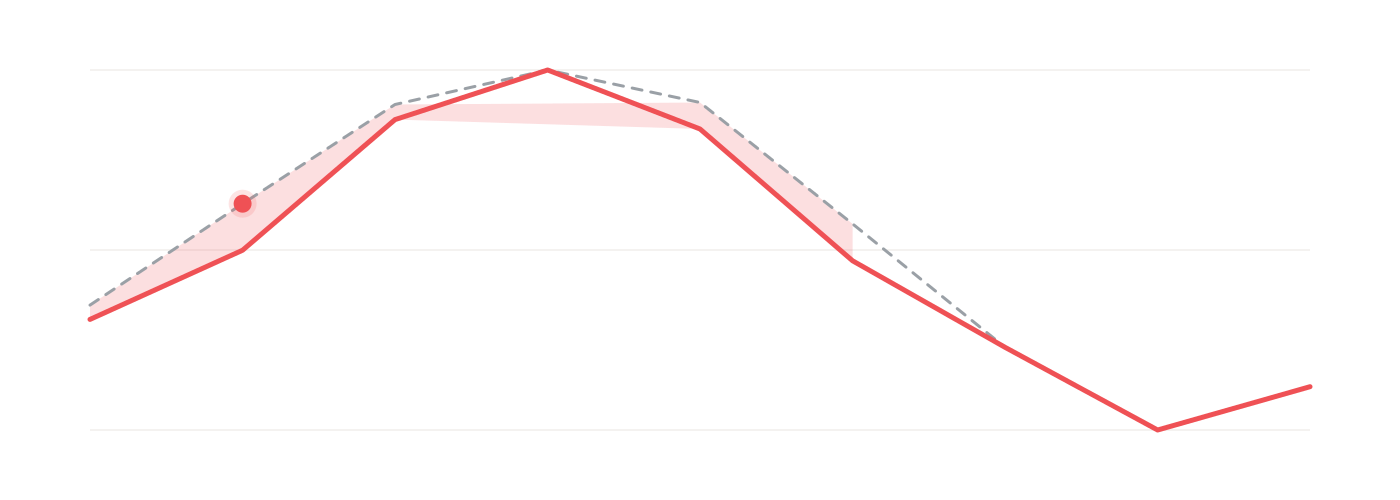 117K litres we cannot make, worth $0.5M
Demand forecastCapacityMargin
117K litres we cannot make, worth $0.5M
Demand forecastCapacityMargin
Three businesses, three different symptoms. Client names stay private; the numbers are theirs.
Unexplained inventory adjustments, every month, for two years. The books balanced. Margin looked stable.
What was underneath. Purchase orders, supplier invoices and warehouse receipts were dated on three different logics. Cost was landing in the wrong period.
$20,000 of unexplained adjustments eliminated, before the next capital commitment was approved.
We had reconciled those numbers every month for two years. Nobody had ever mapped the timing across all three.
A celebrated bestseller: 35% of revenue, treated as the growth engine.
What was underneath. It turned 1.5 times a year. Revenue contribution and capital consumption had never been looked at together.
12% cut in storage cost, and capital that had been stuck for years started moving.
The metric looked like a strength. It was the single biggest drag on our working capital and we had been doubling down on it.
Cash always felt tight, though the business was performing. Materials were bought before the money arrived.
What was underneath. Inflows had never been mapped by project across a forward timeline. It was a sequencing problem, not a shortage.
$300,000 loan retired ahead of schedule, with clear visibility on when cash lands.
We thought we had a cash problem. We had a sequencing problem. Nobody had ever drawn the map.
Get the checklist that goes with this, plus the next tool as it lands. No schedule, no filler.
By clicking Send it to me you agree to receive the newsletter. Cancel any time with one click. Your email is never shared or sold. Privacy.